Terminal Tools for PostGIS
Of late, I've been falling down a bunch of geospatial rabbit holes. One thing has remained true in each of them: it's really hard to debug what you can't see.
There are ways to visualize these. Some more-integrated SQL development environments like pgAdmin recognize and plot columns of geometry type. There's also the option of standing up a webserver to render out raster and/or vector tiles with something like Leaflet. Unfortunately, I don't love either solution. I like psql, vim, and the shell, and I don't want to do some query testing here and copy others into and out of pgAdmin over and over; I'm actually using Leaflet and vector tiles already, but restarting the whole server just to start debugging a modified query is a bit much in feedback loop time.
So: new tools. You need zsh, psql, and per usual, ideally a terminal emulator that can render images. I use wezterm but the only thing you'd need to change is the sole wezterm imgcat call in each. Both can also pipe out to files.
pgisd
The first one, and the tool I used to create the images in the fluviation post. pgisd runs the given SQL script and renders geometry or geography columns in the output. (It actually has to run the query twice, in order to detect and build rendering code for each geom column)
I have some small polygons dumped from rasters, filtered, intersected, sliced, diced, et cetera. My script looks like this:
select
geom,
st_asewkt(st_centroid(geom)) as ewkt_centroid,
format(
'%1$s %2$s, radius %3$s',
round(st_x((st_maximuminscribedcircle(geom)).center)::numeric, 2),
round(st_y((st_maximuminscribedcircle(geom)).center)::numeric, 2),
round((st_maximuminscribedcircle(geom)).radius::numeric, 2)
) as text_largest_circle
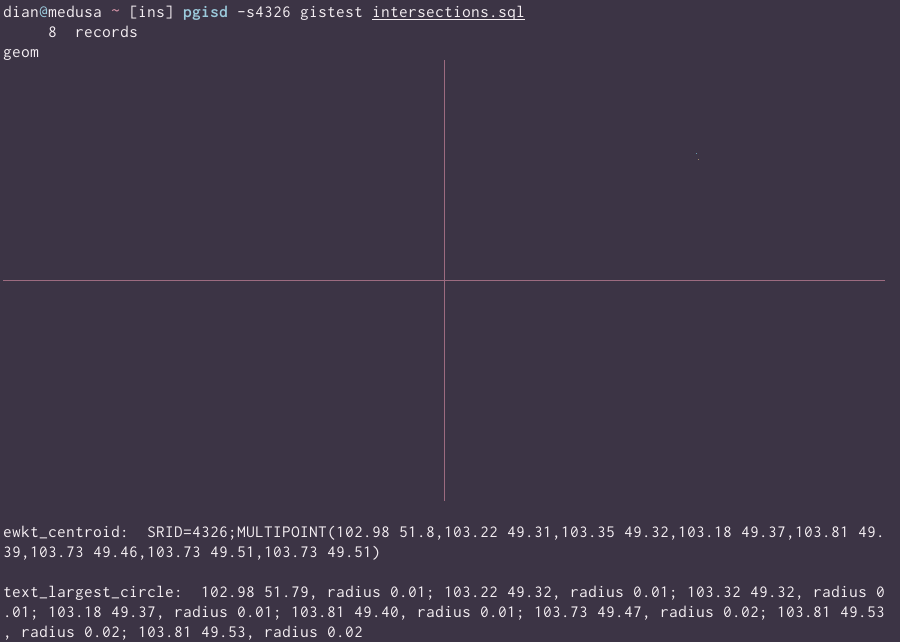
from lots_of_ctesWithout specifying a bounding box, you can barely pick out a couple of dots near where Mongolia would be on a WGS84 projection, given that the whole thing has been squeezed into some 800ish pixels wide:
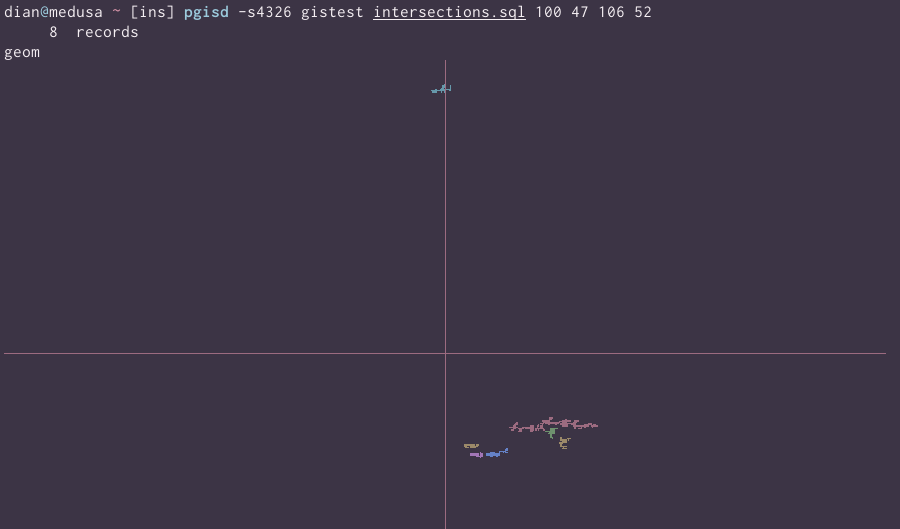
Enhance:
Tweak the where clause to skip that one outlier and focus on the rest (the crosshair gets a bit flaky at around a single degree of width/height):
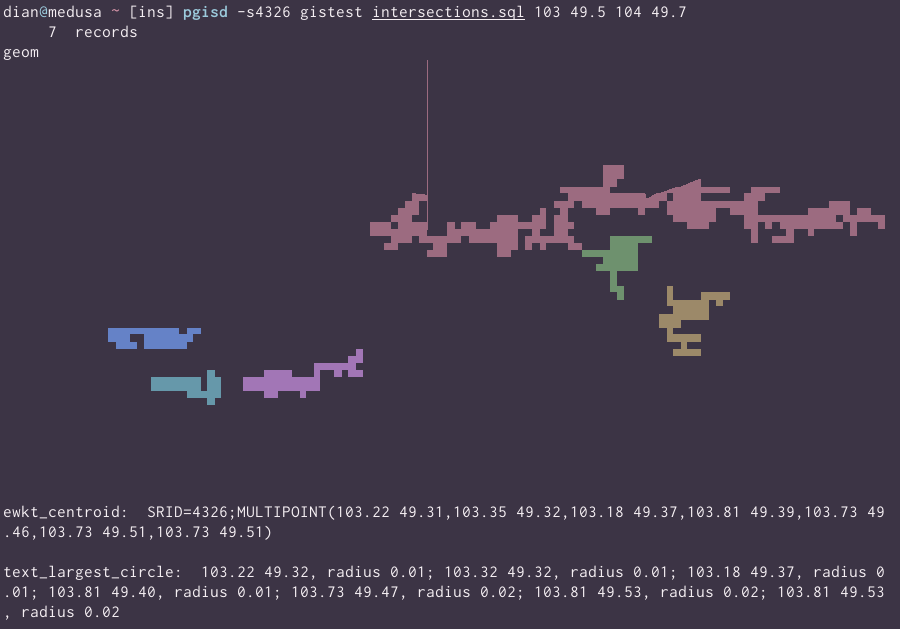
pgisd can also render multiple geom-prefixed (and ewkt-, and text-) columns in sequence. When piped to a file, only the first geometry is rendered and saved.
pgrast
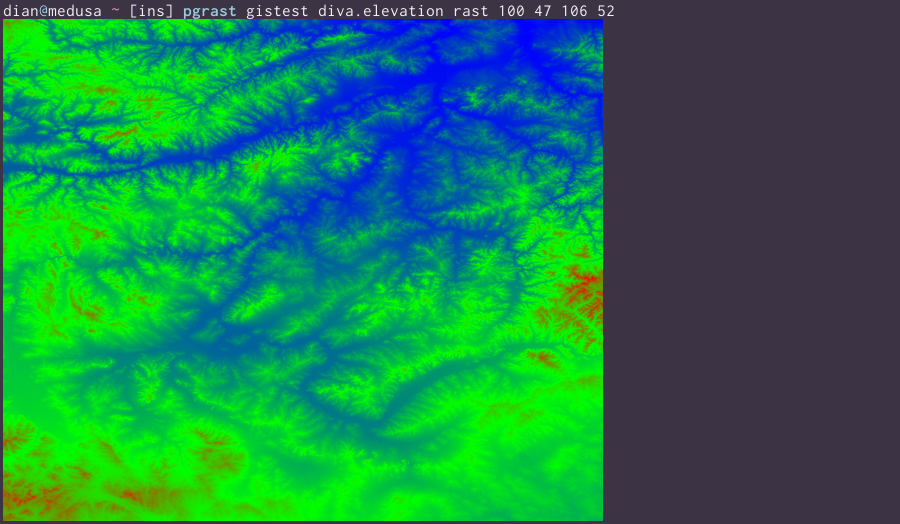
And then I started needing rasters for things like elevation and land cover (with profuse thanks to the International Potato Center's DivaGIS project for compiling a ton of these for free!). This one's a bit simpler -- a raster is a raster, you locate the column and define a bounding box for the area you're interested in. Here's the location we were just looking at geometry intersections over:
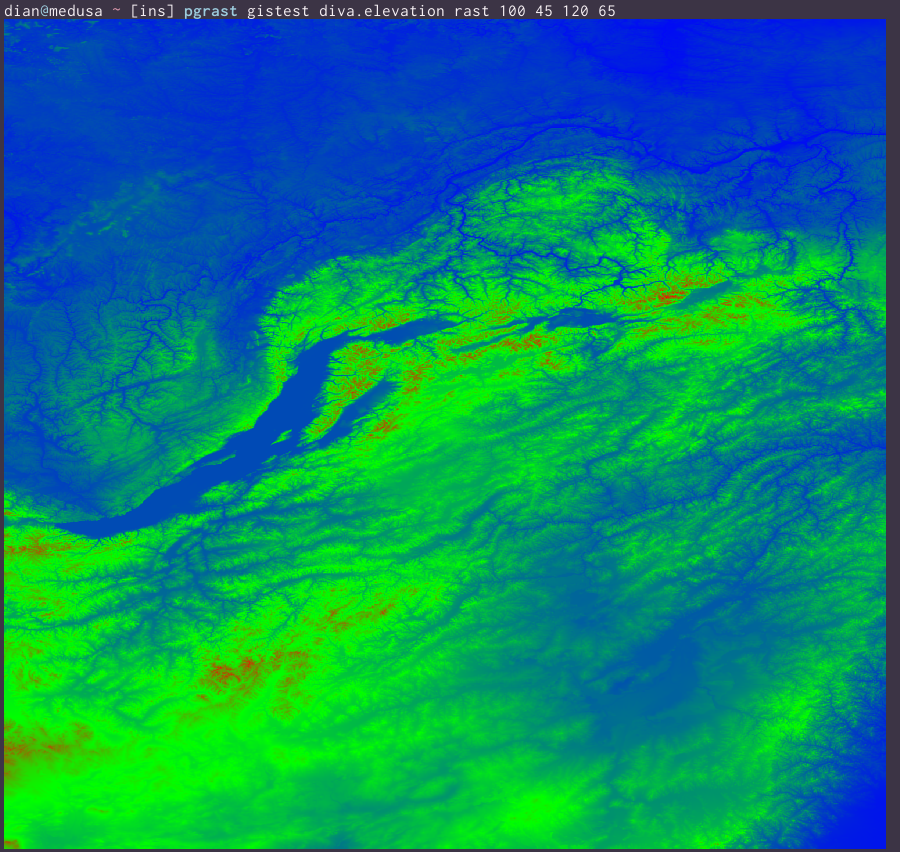
And looking a little further east, here's the northeastern part of the Mongolian plateau in full; that's Lake Baikal at center-left.
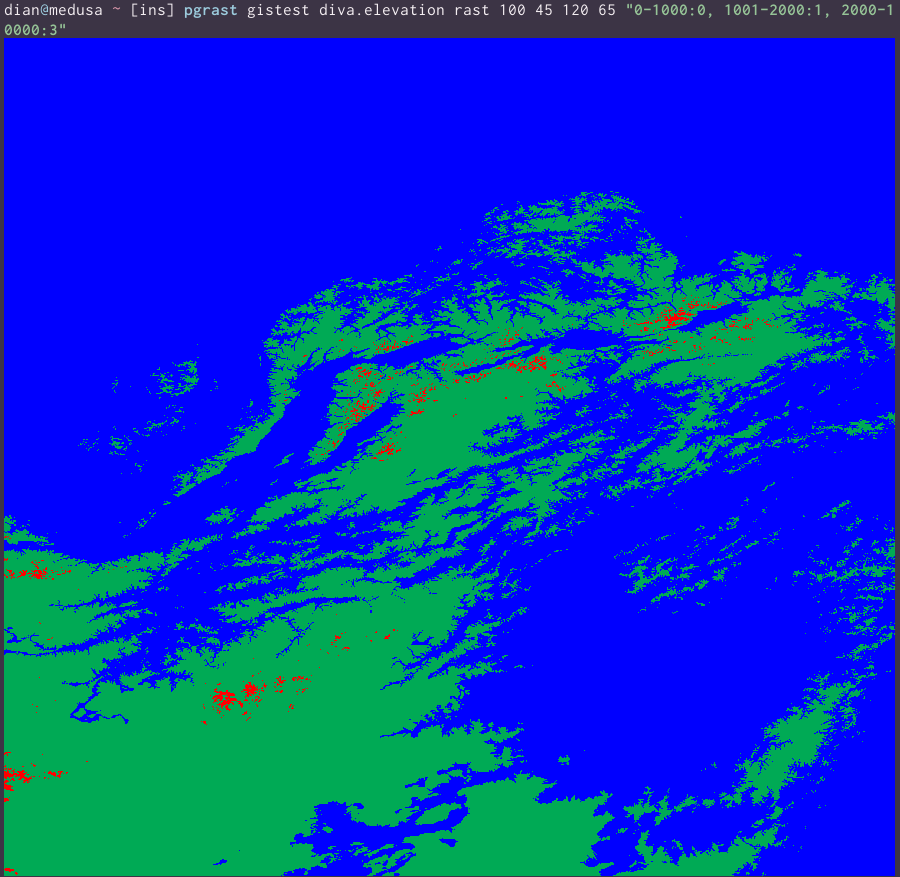
But what if we want to simplify it? This came up a lot with the land cover, where each pixel value is one of 22 options (1 is broadleaf evergreen forest, 13 is grassland, 22 is urban) and I only wanted to see a few at a time, but pgrast's reclass option also works to flatten the pseudocolor output. Here's the same raster, where elevation < 1000m is blue, 1000-2000m is green, and anything above 2000m is red: