pdot: Exploring Databases Visually, Part II
A couple years ago, I wrote about exploring a running database by plotting relevant subsets of the foreign key relationship graph in dot and piping the resulting images directly to the terminal. Things have progressed since then:
- I supplemented the original
fksshell script with others plotting view dependencies, role hierarchies and grants, and finally started to map the effects of triggers and functions; - I hit my personal ceiling of What It Is Reasonable To Do In Shell Scripts, and decided to pull all this stuff together into a single cross-platform program with a consistent interface;
- I did that, and added mermaid support for good measure;
- & then, I forgot to write anything about having released it for a couple of months, as you do
The fks side of things hasn't changed much from the earlier post (aside from some niceties around table inheritance), so here's the big new thing:
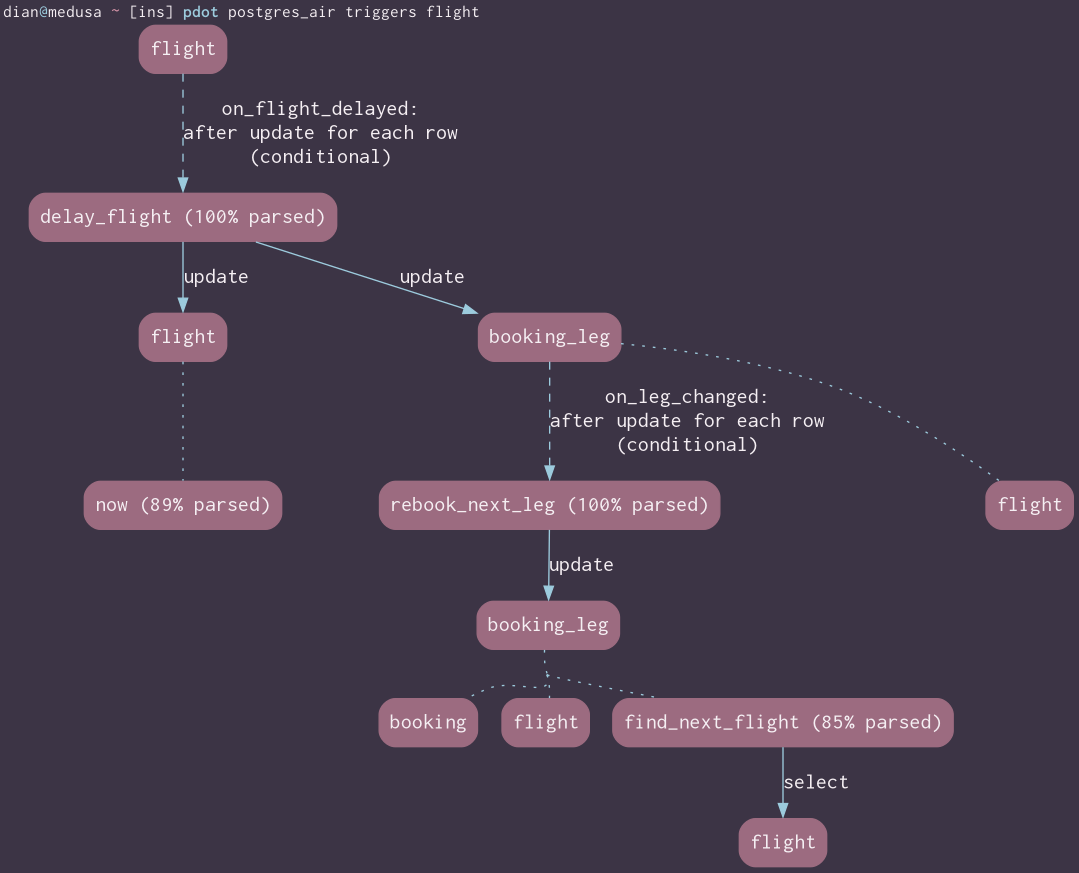
pdot is out for Linux (including the Arch AUR), Windows, and macOS universal. I'll be talking more about it and exploration as a documentation strategy at the Chicago PUG in November, and possibly elsewhere!